![]()
You can run this notebook in a live session or view it on Github.
Custom Indexes#
Xoak provides some built-in adapters for xarray.indexes.NDPointIndex ; it is easy to create custom ones.
[1]:
import numpy as np
import xarray as xr
Example: add a brute-force “index”#
This example adapter simply performs brute-force nearest-neighbor lookup by computing the pairwise distances between all index and query points and finding the minimum distance.
[2]:
from collections.abc import Mapping
from typing import Any

from sklearn.metrics.pairwise import pairwise_distances_argmin_min
from xarray.indexes.nd_point_index import TreeAdapter


class BruteForceTreeAdapter(TreeAdapter):
    """Brute-force nearest neighbor lookup."""

    def __init__(self, points: np.ndarray, options: Mapping[str, Any]):
        self._index_points = points

    def query(self, points: np.ndarray) -> tuple[np.ndarray, np.ndarray]:
        positions, distances = pairwise_distances_argmin_min(points, self._index_points)
        return distances, positions

    def equals(self, other: "BruteForceTreeAdapter") -> bool:
        return np.array_equal(self._index_points, other._index_points)
Let’s use this adapter in the basic example below:
[3]:
# create mesh
shape = (20, 20)
x = np.random.uniform(0, 100, size=shape)
y = np.random.uniform(0, 100, size=shape)
field = x + y
ds_mesh = xr.Dataset(
coords={'meshx': (('x', 'y'), x), 'meshy': (('x', 'y'), y)},
data_vars={'field': (('x', 'y'), field)},
)
# set the brute-force index (doesn't really build any index in this case)
ds_mesh = ds_mesh.set_xindex(
['meshx', 'meshy'],
xr.indexes.NDPointIndex,
tree_adapter_cls=BruteForceTreeAdapter,
)
# create trajectory points
ds_trajectory = xr.Dataset({
'trajx': ('trajectory', np.linspace(0, 100, 20)),
'trajy': ('trajectory', np.linspace(0, 100, 20))
})
# select mesh points
ds_selection = ds_mesh.sel(
meshx=ds_trajectory.trajx,
meshy=ds_trajectory.trajy,
method="nearest",
)
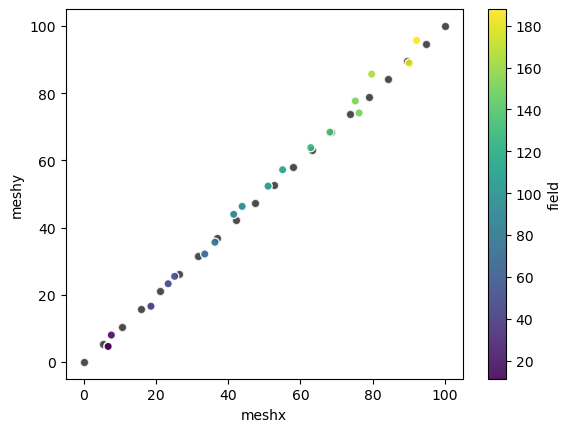
# plot results
ds_trajectory.plot.scatter(x='trajx', y='trajy', c='k', alpha=0.7);
ds_selection.plot.scatter(x='meshx', y='meshy', hue='field', alpha=0.9);
Matplotlib is building the font cache; this may take a moment.